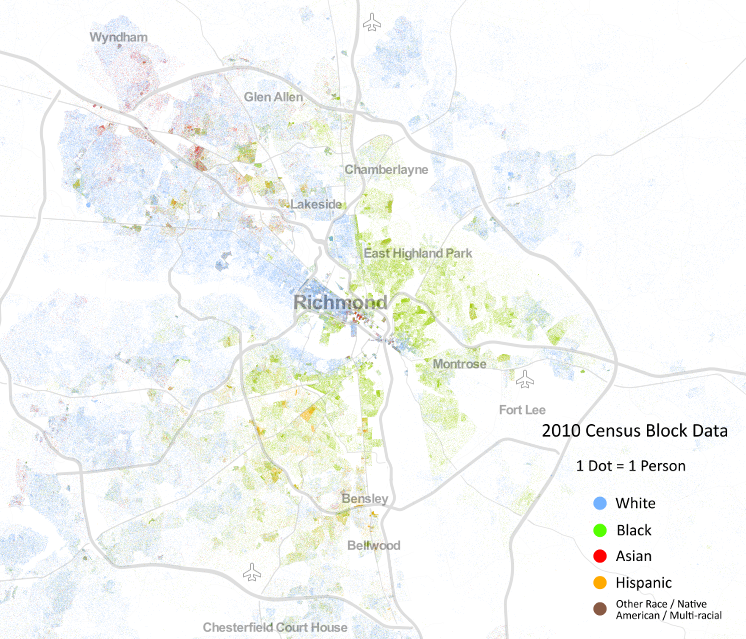
For the past few days I’ve been playing with an amazing map developed by a team at UVA attempting to display census data in a more accessible way. Take a look at Richmond:
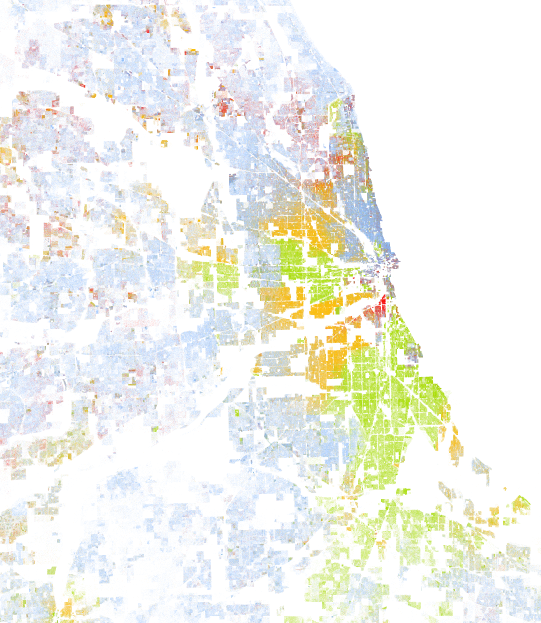
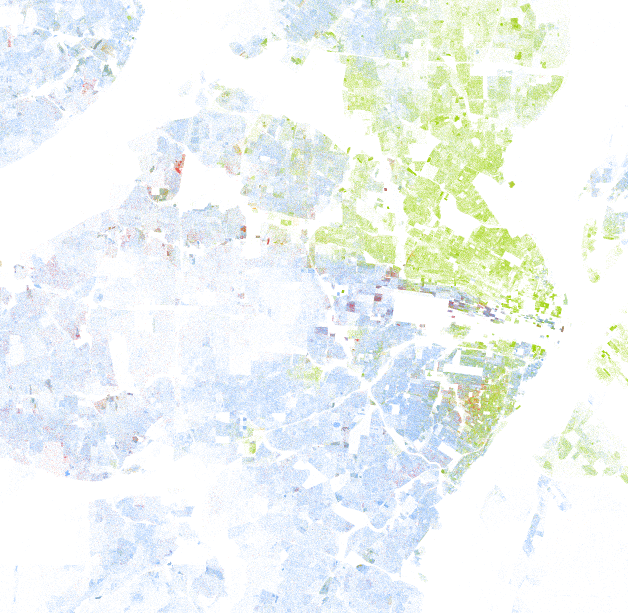
Chicago:
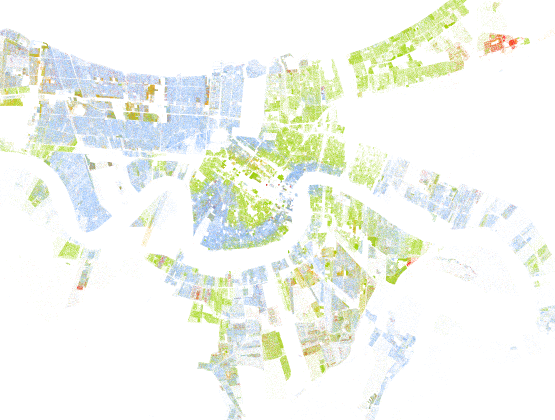
New Orleans:
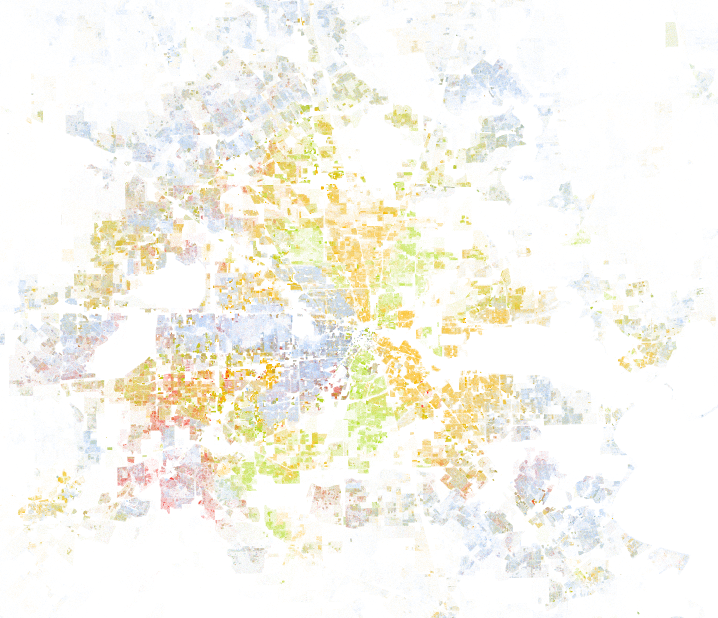
Houston:
St. Louis:
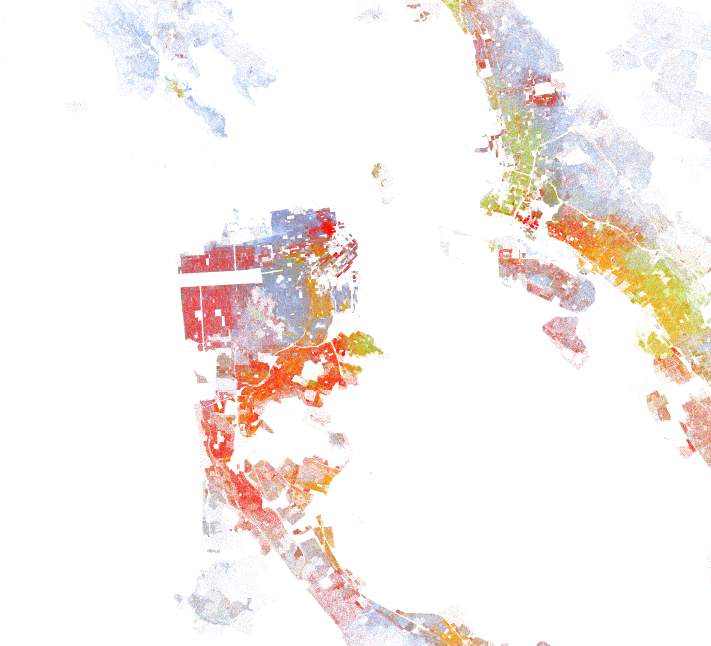
The Bay Area
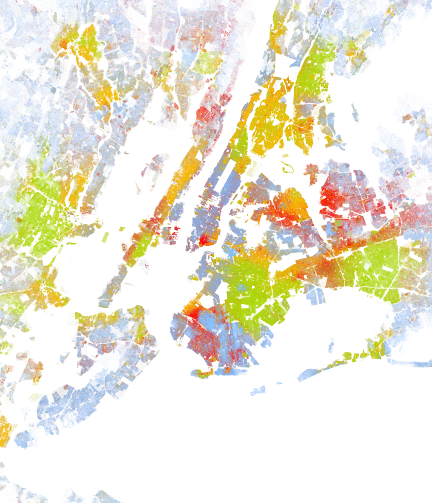
NYC and surrounding region:
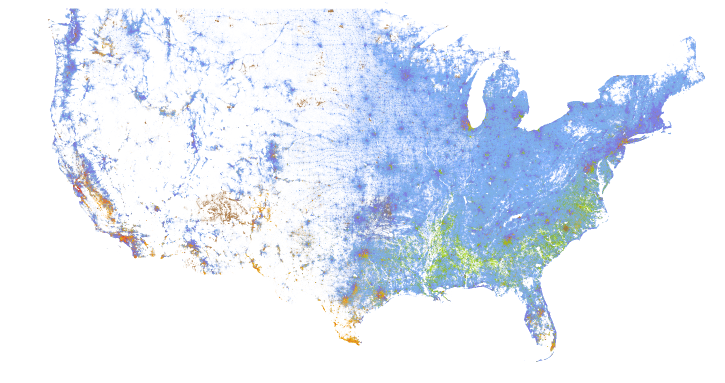
And the Whole Shebang: